Budget Variance visualization tabs
Use the Budget Variance visualization tabs to explore high-level variances between actual and budgeted data.
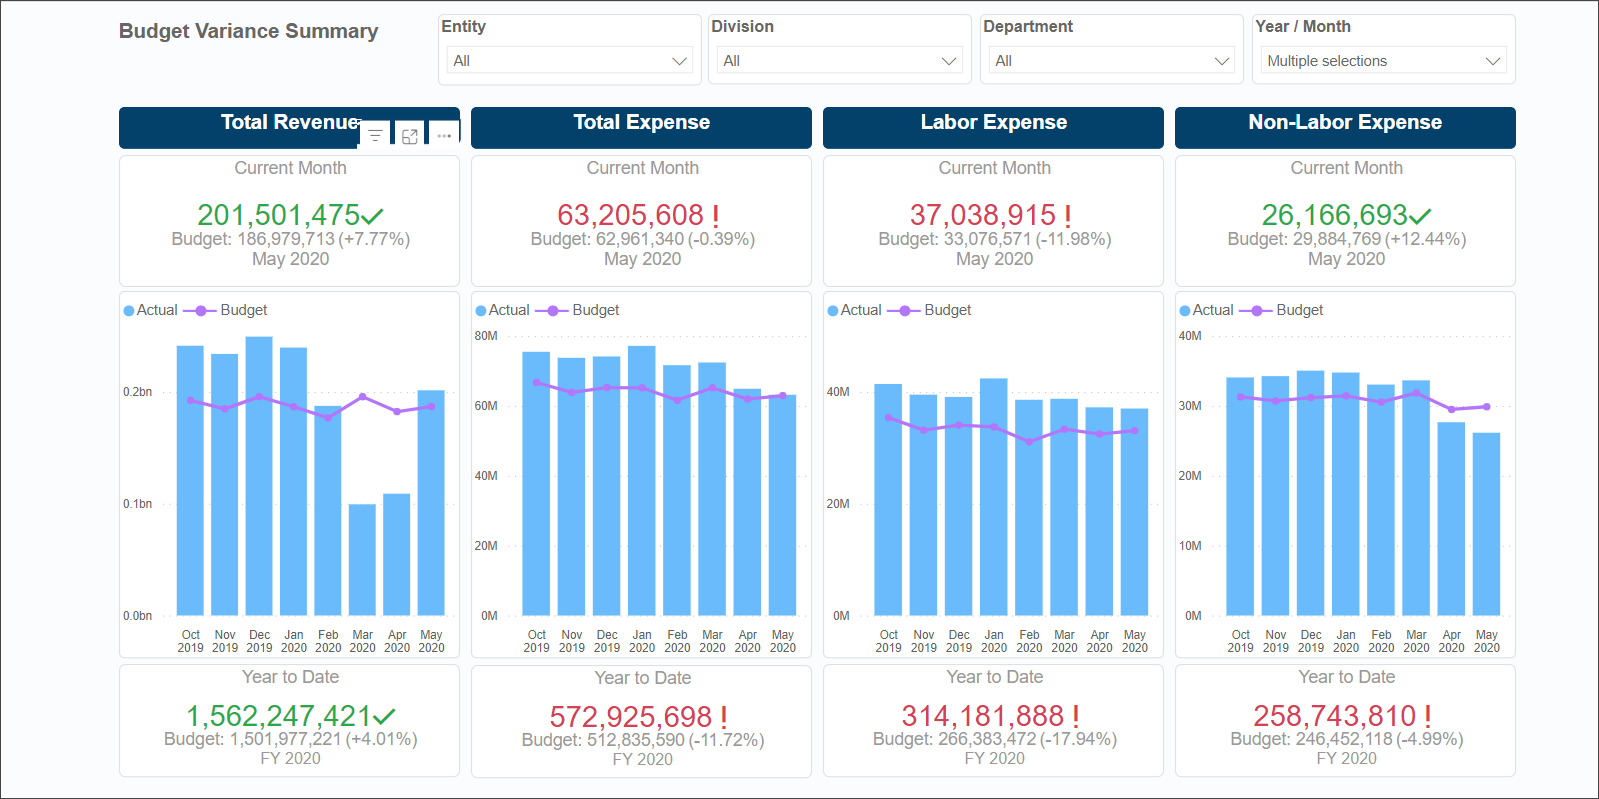
This tab provides totals for each of the main reporting areas:
- Revenue
- Expenses
- Labor Expenses
- Non-Labor Expenses
The tab also includes trend information and KPI data.
Budget Variance features
The following features are available on the various tabs of the Budget Variance page
| Feature | Description | Tab |
|---|---|---|
| Slicers |
Special filters for narrowing report data to the options selected from the Entity, Division, Department, and Year/Month categories. These slicers appear at the top of every tab in the report. Slicers are synchronized so that selections on one tab change data on the remaining tabs. You can make multiple selections from a slicer menu by pressing Ctrl while making selections. |
All |
| KPI cards |
At-a-glance statistics for the Current Month and Year-to-Date (YTD) variance amounts. The large numbers are actuals with the budgeted amount displayed in gray text under the actuals. YTD totals are based on the months selected in the Year/Month slicer and always display the latest Fiscal Year (FY) information. For example, if you select July and August from 2022, the YTD values would sum those two months. If you select June 2021, July 2022, and August 2022, the YTD total includes only July 2022 and August 2022 because 2022 is the most recent fiscal year among the months you selected. |
Summary Revenue Labor Expense Labor Analysis Non-Labor Expense |
| Bar graphs with trend items |
Interactive graphs that depict data over specified periods. Click a bar or a point on the trend line to view data related to just that item on the rest of the tab. |
Revenue Labor Analysis
|
| Rollover toolbars |
A set of hidden tools for interacting with the report data. Each report section has a toolbar that appears just above the upper-right corner when you hover your cursor over the report section. Select a tool from the popup toolbar. For more information about each tool, see Visualization tools. |
Summary Revenue Labor Expense Non-Labor Expense Expense Variance |
| Revenue Variances by Division table | The Variance and Var % columns expand to reveal the data associated with the selected item and level. Variance percentages are color-coded to indicate potential areas that need attention and those that did better than predicted. The darker the shading, the greater the variance. | Revenue |
| Revenue by month line graph | Interactive graph that depicts data based on drill level and selected areas of the graph. Hover your cursor over any point to view an informational popup or click a point to view related data on the rest of page. Both the bar graph and the Revenue by account table change to display data associated with the selected point. | Revenue |
| Revenue by type bar graph | Interactive graph that depicts revenue data based on drill level and selected areas of the graph. Click a bar on the graph to view data related to that item. Both the line graph and the Revenue by account table also change to display data associated with the selected bar. | Revenue |
| Revenue by account table | Click a listing in the table to view data related to just that item in the rest of the tab sections. |
Revenue
|
| Labor Expense Variances by Division table | The Variance and Var % columns expand to reveal the data associated with the selected item and level. Variance percentages are color-coded to indicate potential areas that need attention and those that did better than predicted. | Labor Expense |
| Labor Expense by month line graph | Interactive graph that depicts data based on drill level and selected areas of the graph. Hover your cursor over any point to view an information pop-up, or click a point to view related data on the rest of tab. | Labor Expense |
| Labor Expense by type bar graph | Interactive graph that depicts data related to labor expenses based on drill level and selected areas of the graph. Click a bar on the graph to view data related to that item. Both the line graph and the Labor Expense by account table also change to display data associated with the selected bar. | Labor Expense |
| Labor Expense by account table | Interactive graph that depicts data related to labor expenses based on drill level and selected areas of the graph. Click a bar on the graph to view data related to that item. Both the line graph and the Labor Expense by account table also change to display data associated with the selected bar. | Labor Expense |
| Non-Labor Expense Variances by Division table | The Variance and Var % columns expand to reveal the data associated with the selected item and level. Variance percentages are color coded to indicate potential areas that need attention, and those that did better than predicted. | Non-Labor Expense |
| Non-Labor Expense by month line graph | Interactive graph that depicts data based on drill level and selected areas of the graph. Hover your cursor over any point to view an information pop-up, or click a point to see the data related to it displayed on the rest of tab. | Non-Labor Expense |
| Non-Labor Expense by type bar graph | Interactive graph that depicts data related to non-labor expenses based on drill level and selected areas of the graph. Click a bar on the graph to view data related to that item. Both the line graph and the Non-Labor Expense by account table change to display data associated with the selected bar. | Non-Labor Expense |
| Non-Labor Expense by account table | Click a listing in the table to view data related to just that item in the rest of the tab sections. | Non-Labor Expense |
| Field trail | Names of the selected drill fields are displayed above each branch. | Expense Variance Analysis |
| Starting variance | Starting Expense variance. Click the plus symbol at the right end of the variance bar and then, from the pop-up menu, select the field to use for the first branch of the tree. | Expense Variance Analysis |
| Drill fields | Column of data items in each branch’s drill field. You can start a branch from any field with a plus symbol at the end. | Expense Variance Analysis |
Additional tabs
The following tabs are also available on the Budget Variance page:
| Tab | Description |
|---|---|
| Revenue | Revenue variances starting by division, with the ability to drill down to account detail. |
|
Labor Expense |
Labor expense variances starting with a selected Division, with the ability to drill down to account detail. The layout and functionality of this tab are the same as that for the Revenue tab. |
|
Labor Analysis |
Variance data related to labor. This tab provides multiple KPIs for Labor indicators and three trend graphs of the most commonly used indicators for analyzing labor expenses. |
|
Non-Labor Expense |
Variance data related to non-labor expenses. The layout and functionality of this tab are the same as for the Revenue and Labor Expenses tabs. |
|
Expense Variance Analysis |
Variance related to expenses. |
